Skip to content
Back to portfolioPower BI

Multi-Business Dashboard

The Multi-Business Power BI Dashboard provides an interactive overview of Parlor and Tailor businesses using KPIs, charts, tables, filters, and slicers to analyze and compare performance by date or category.

Multi-Business Dashboard

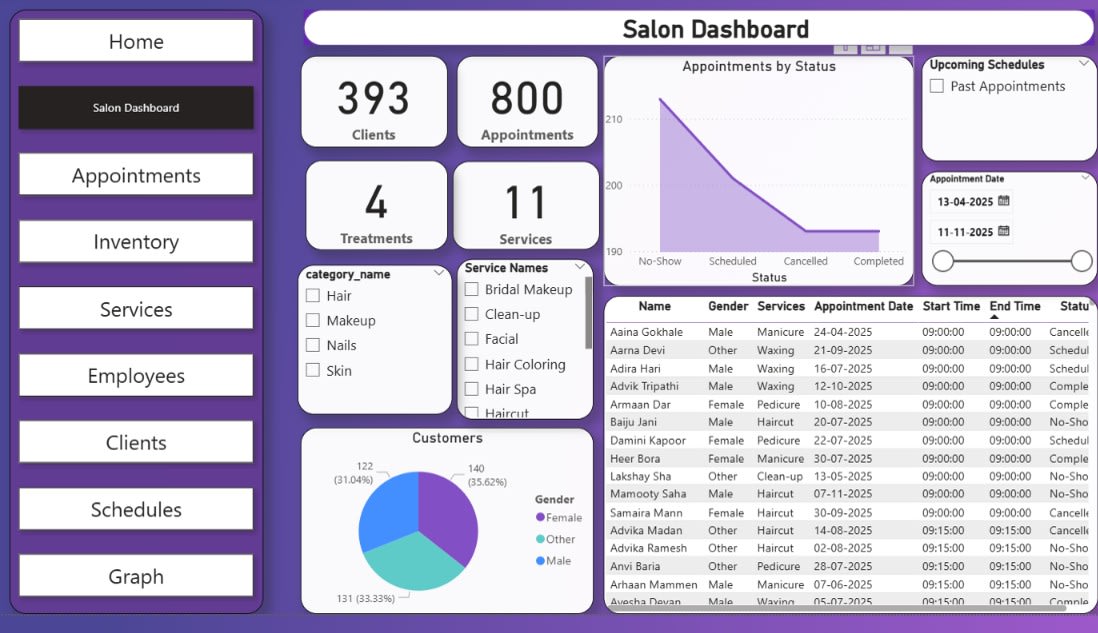
The Multi-Business Power BI Dashboard is an interactive business intelligence solution developed to provide an overall view of multiple business operations in a single dashboard. The project focuses on analyzing and comparing different types of businesses, including Parlor and Tailor businesses, by presenting their important business information through interactive KPIs, charts, tables, filters, and slicers.

The dashboard provides users with a centralized overview of business performance, making it easier to monitor important metrics and understand the overall status of each business. Users can apply different filters and slicers to view data for a particular business, date, or category according to their requirements. This allows users to analyze each business individually as well as compare the performance of different businesses.

For the Parlor business, the dashboard can be used to analyze customer-related activities, services, sales, and other important business metrics. Similarly, the Tailor business section provides insights into tailoring-related activities, orders, customers, and business performance. By bringing these different business areas together, the dashboard provides a consolidated view while still allowing detailed analysis of individual businesses.

Overall, the Multi-Business Dashboard helps simplify business data analysis by converting raw business information into clear and meaningful visual insights. It reduces the need for manual reporting and provides users with an easy-to-use platform to monitor, filter, compare, and understand the performance of various businesses from a single Power BI dashboard.

Key features

  • Multi-Business Analysis: Centralized dashboard for analyzing multiple businesses in one place.
  • Business Performance KPIs: Displays important metrics for quick performance monitoring.
  • Interactive Visualizations: Uses charts, tables, and graphs to present business insights clearly.
  • Business-wise Filtering: Allows users to view data for specific businesses such as Parlor and Tailor.
  • Date & Category Filters: Analyze business data based on selected dates and categories.
  • Performance Comparison: Helps compare the performance of different businesses.
  • Interactive Slicers: Enables users to dynamically filter and explore dashboard data.
  • Centralized Reporting: Combines information from different businesses into a single reporting x

Outcome

The project provides a centralized and interactive view of multiple businesses, helping users easily monitor, analyze, and compare business performance. It simplifies complex business data through visual reports, KPIs, filters, and slicers, supporting better and faster decision-making.
Careers & Culture

Careers at VVSPL

Browse open roles across our technical and value creation teams, and apply directly through our application portal.

  • Simple ApplicationComplete your application via our official online portal.
  • Direct SubmissionYour resume and profile go directly to our HR & Talent team.
  • Fast TurnaroundWe review applications promptly and reach out to shortlisted candidates.